From Data to Decisions: Using Student Analytics to Drive Improvement
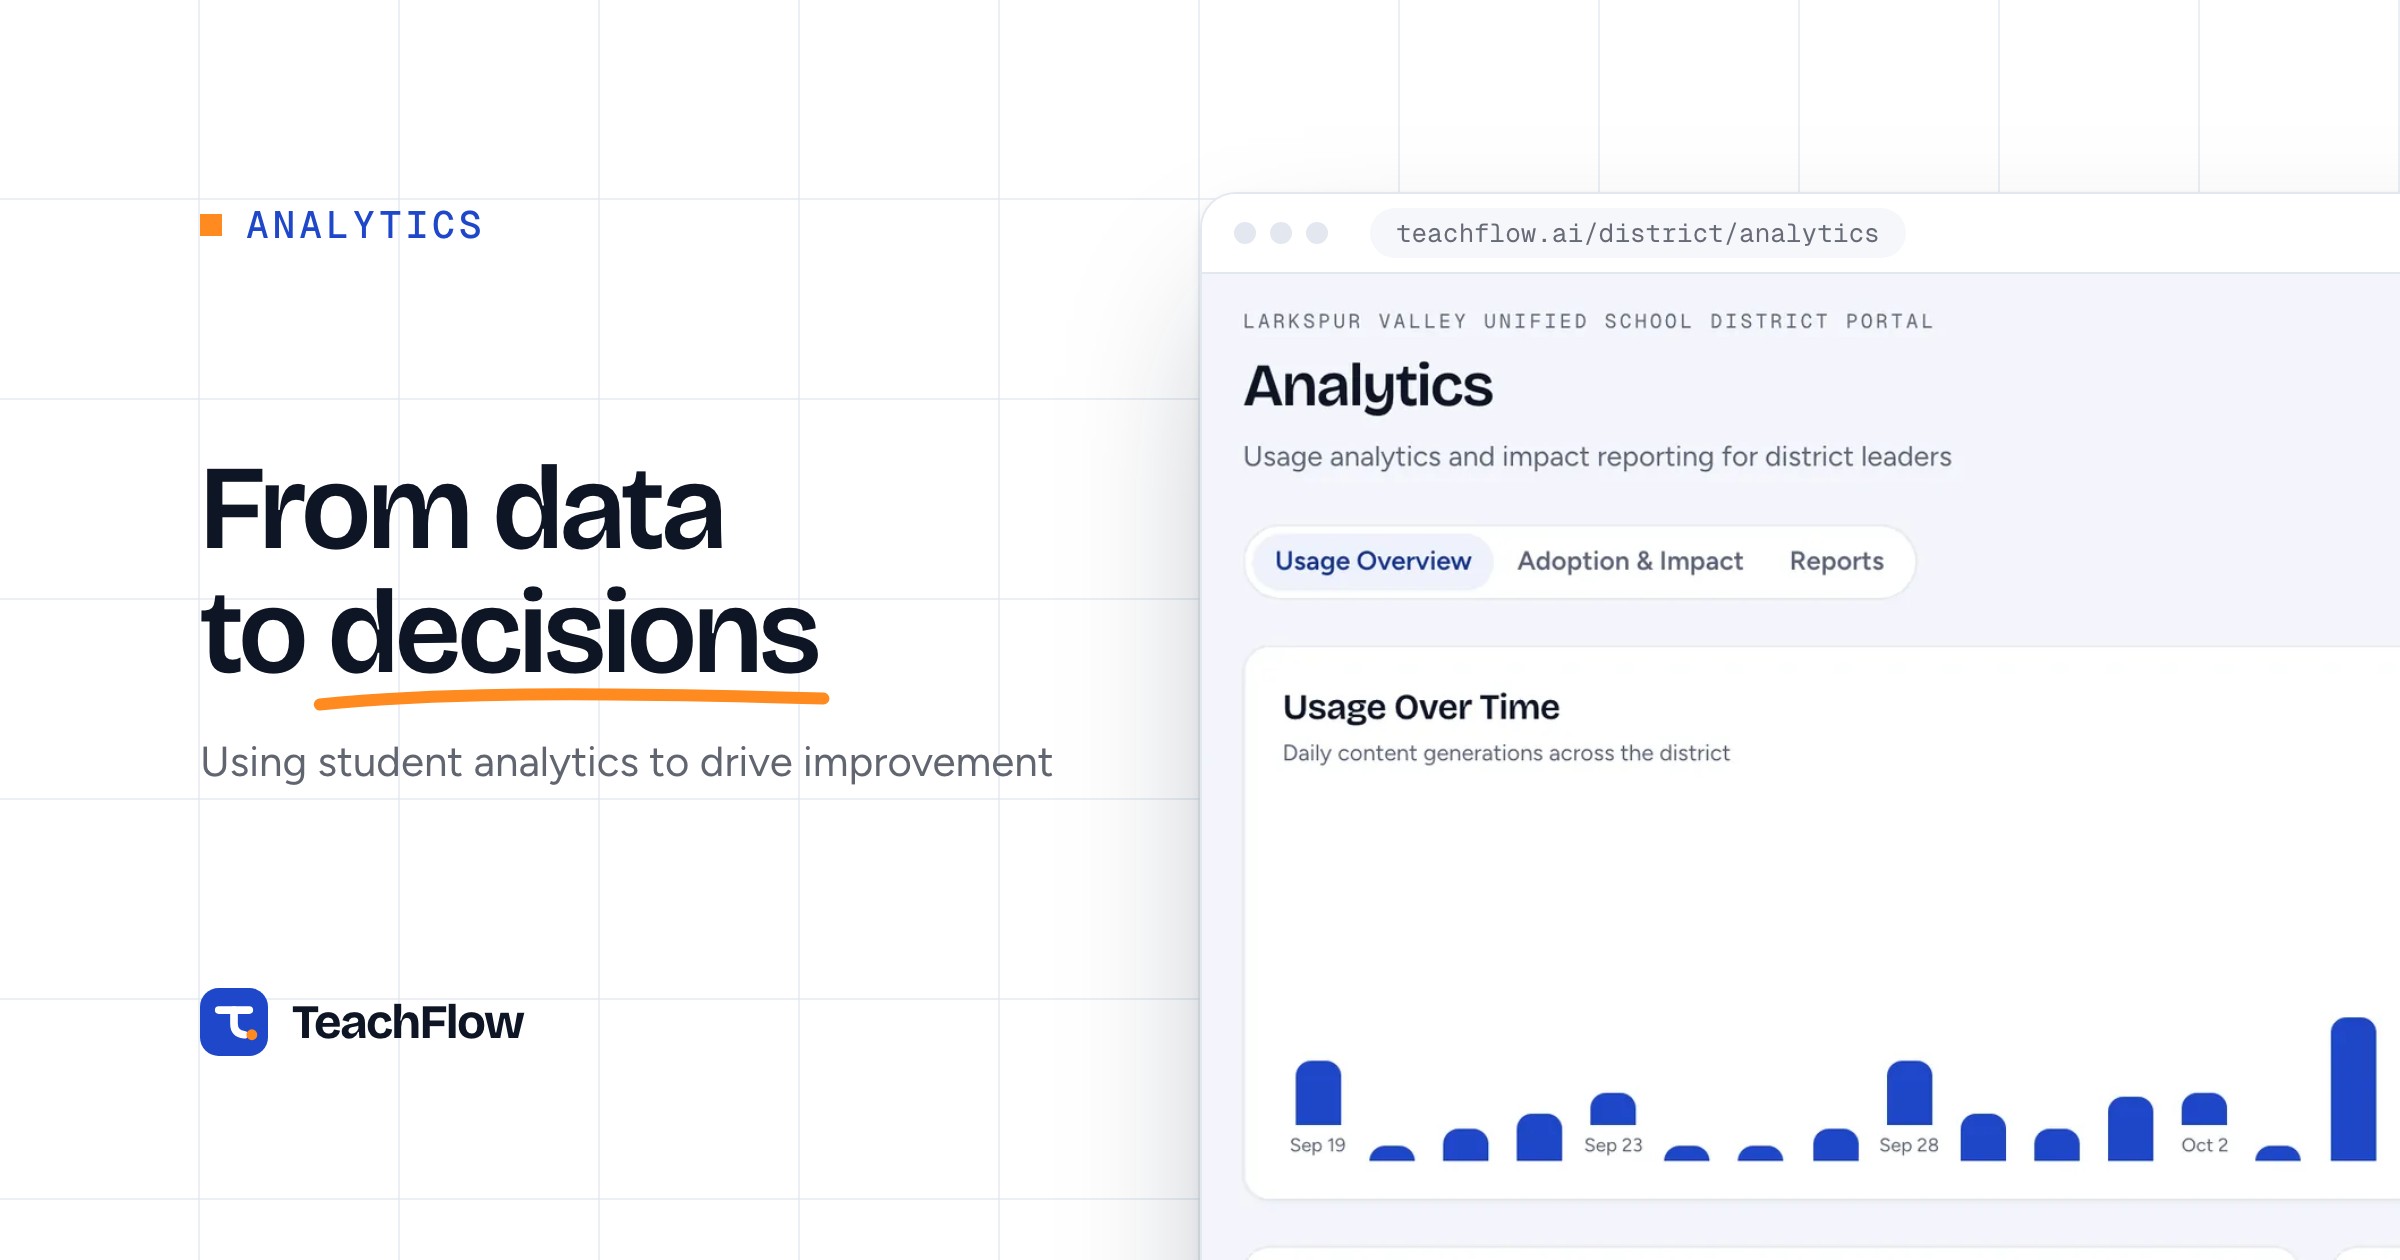
Most teachers are surrounded by student data — quiz scores, assignment completion rates, participation patterns, attendance records — but relatively few have the time or tools to turn that data into actionable insights. The gap is not analytical skill; teachers are naturally good at noticing patterns. The gap is structure: data scattered across different platforms, gradebooks, and spreadsheets is hard to synthesize quickly enough to influence the next day's instruction. When the data review happens at all, it often happens too late to make a difference for the current unit.
The most useful analytics for classroom teachers are the ones that surface at the right time and at the right level of specificity. A class-level view showing the distribution of scores on the most recent assessment tells you whether your whole class struggled with a concept or whether the difficulty is concentrated in a subset of students. A student-level view showing performance trends over time tells you whether a struggling student is improving, plateauing, or declining — which changes what kind of intervention makes sense. Neither of those insights requires complex data science; they require having the data in one place and visualized in a way that takes seconds to interpret rather than minutes.
Turning data into decisions also requires a commitment to acting on what you find. This sounds obvious, but many teachers have experienced the frustration of doing a careful data review, identifying students who need support, and then having no practical way to act on those findings given the constraints of a full teaching schedule. The most effective schools build data-to-action workflows into their planning structures — brief weekly review periods, a clear protocol for flagging students who need intervention, and defined ways to adjust upcoming instruction based on what the data shows. The analytics are only as valuable as the decisions they enable.